VS Code: the Best GUI Debugger for Node.js Apps
I’ve been a user of Sublime Text since… forever. I love a good IDE (having worked across various stacks I’m pretty comfortable in Xcode, IntelliJ, and Visual Studio) but when I come back to Node—and just general text editing—I always end up back in Sublime.
But you know what I love more than anything? A good debugger. Debuggability is my number one priority as an experienced developer.
Is this code good? Who cares… can I step in and step over? If I can do that, I can understand anything.
This means that I try to avoid events, excessive parallelism, and other fun abstractions not because they’re not useful, but because there’s not a clear method hierarchy. I want to be able to step through the code and see a call stack. When I’ve been a newcomer to 10+ year old codebases, the best way I’ve found to get a mental model of the whole system is by tracing a call from the UI layer all the way through.
Now here’s the part where I explain that I’m an idiot. I’ve been doing server-side Node.js for at least five years. On major projects too. I’ve never had a good debugger. I knew I needed a debugger and I knew I wanted a debugger. But I kept putting it off (“pssh, non-coding work? Waste of time.”) or deciding it wasn’t worth the hassle (“I’m keeping it old school with console.log”).
Part of the reason I kept putting off using a debugger was because I thought it’d involve a bunch of weird configuration settings, time-wasting tweaks, and inconsistent functionality. All to get something that half-worked and was only a little bit better than console.log. I was totally wrong. Setting up VS Code is painless and, most importantly, works exactly the way you’d expect.
So I’m super late to the party, but Visual Studio Code’s debugger is great and simple. It’s by far the best Mac GUI debugger for Node.js development. It supports a bunch of other languages and runtimes other than Node.js as well, plus it runs across Mac, Linux, and Windows.
Guide
Here’s a quick tour that’ll get you debugging Node.js apps with VS Code like an adult. (The codebase is for Emoji Bullet List in case you’re curious.)
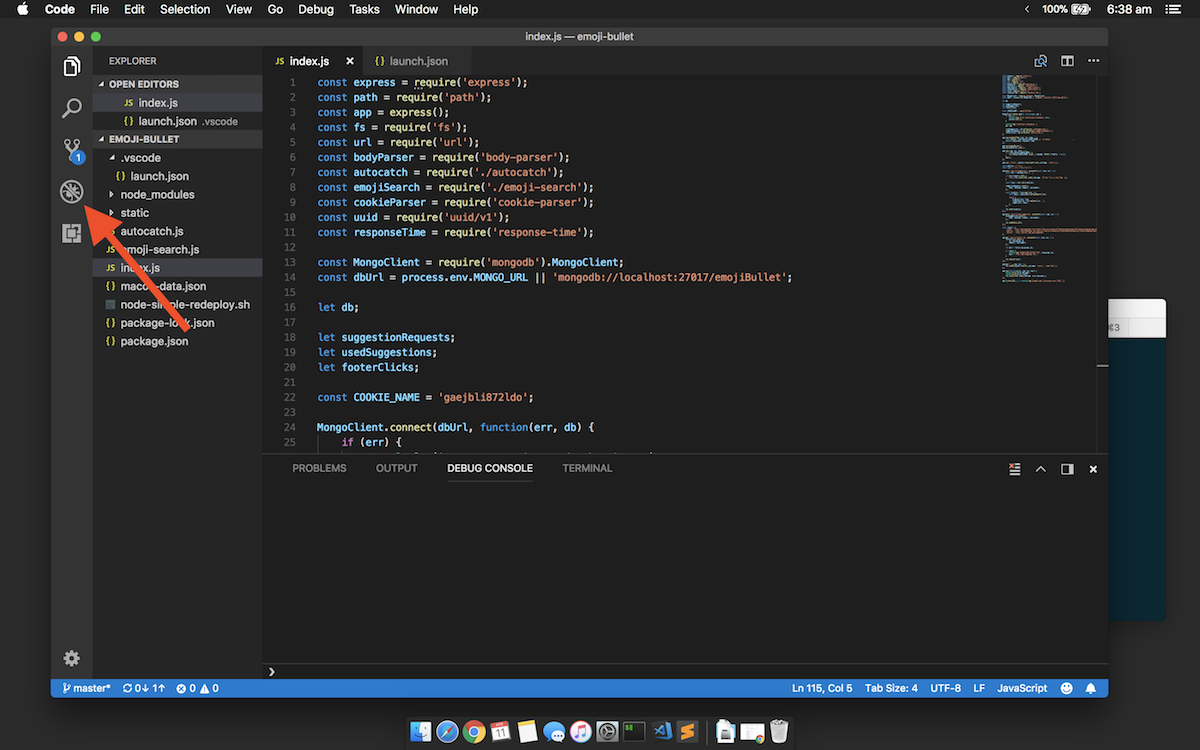
Debug panel
Activate the Debug panel by clicking the no-bugs button in the sidebar on the left.
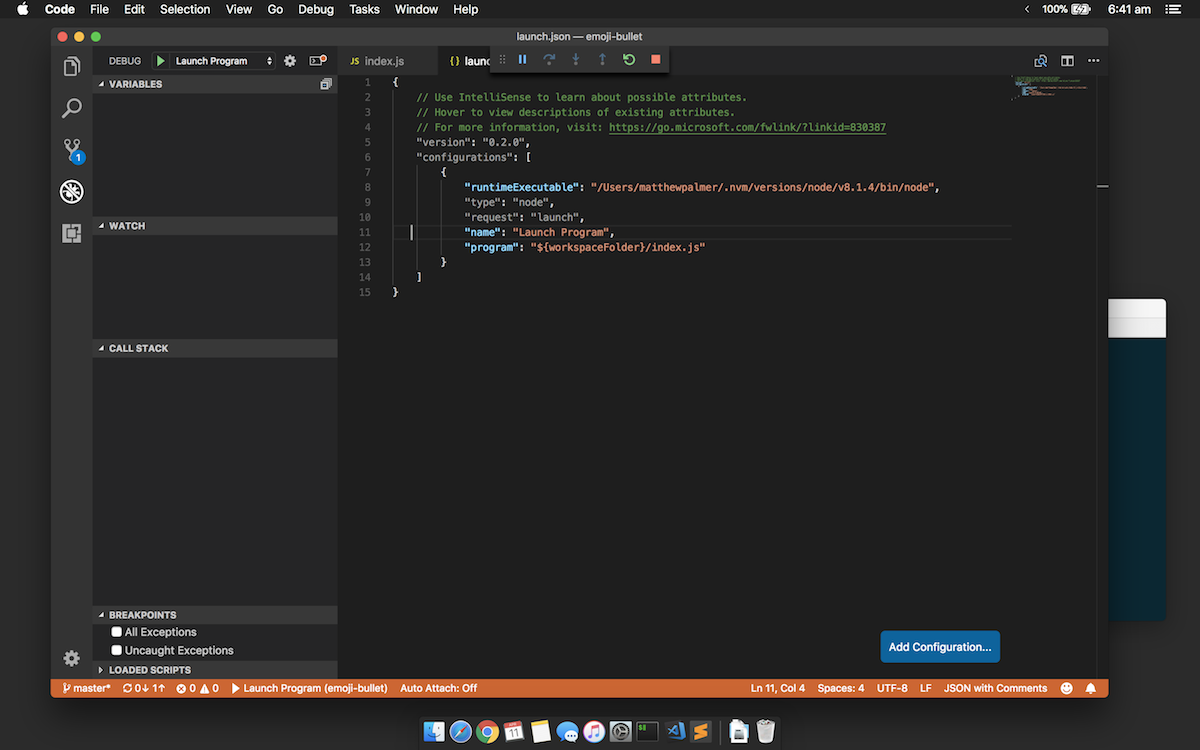
launch.json
Open or create your launch.json file by clicking the cog at the top. This file controls how your application launches, which version of Node to use, what arguments to pass, environment settings, and a bunch of other things. You can even set up multiple launch configurations.
Since I use fish and nvm, I had to add a runtimeExecutable entry to point to the specific Node.js version I wanted to use. If you need to figure this out, which node might come in handy.
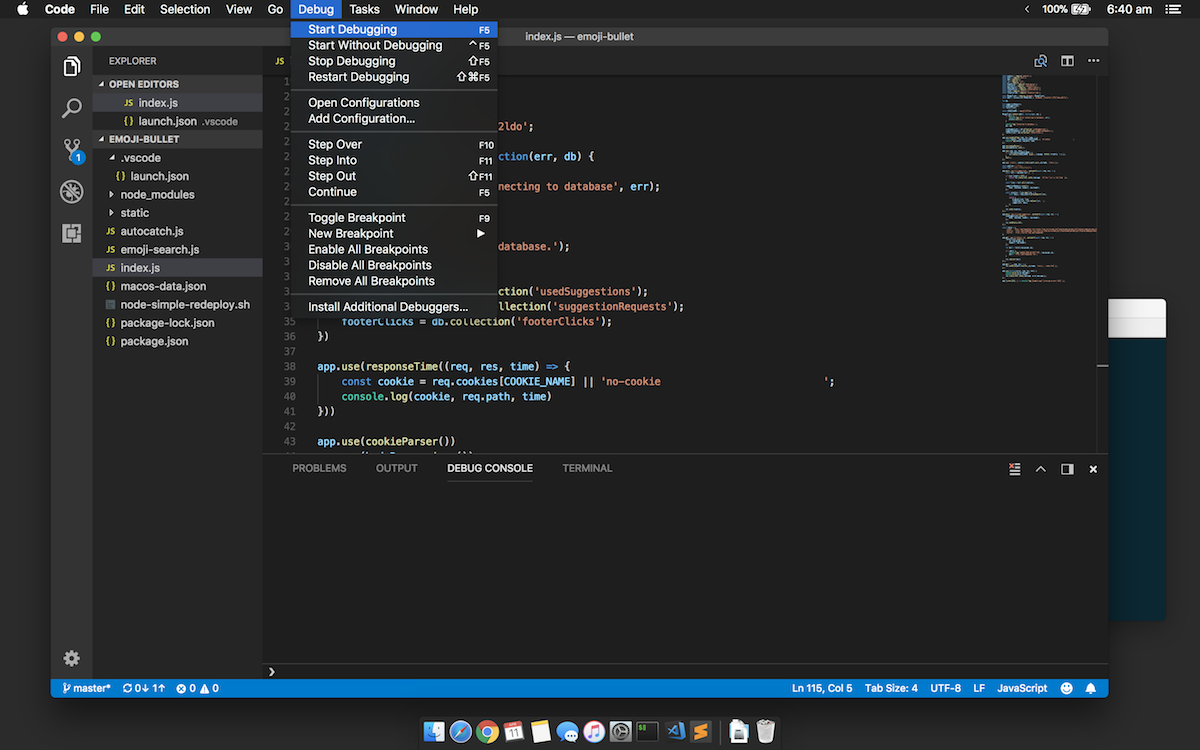
Start debugging
Starting to debug your app is super easy—just hit F5 or select Debug > Start Debugging. As simple as it should be!
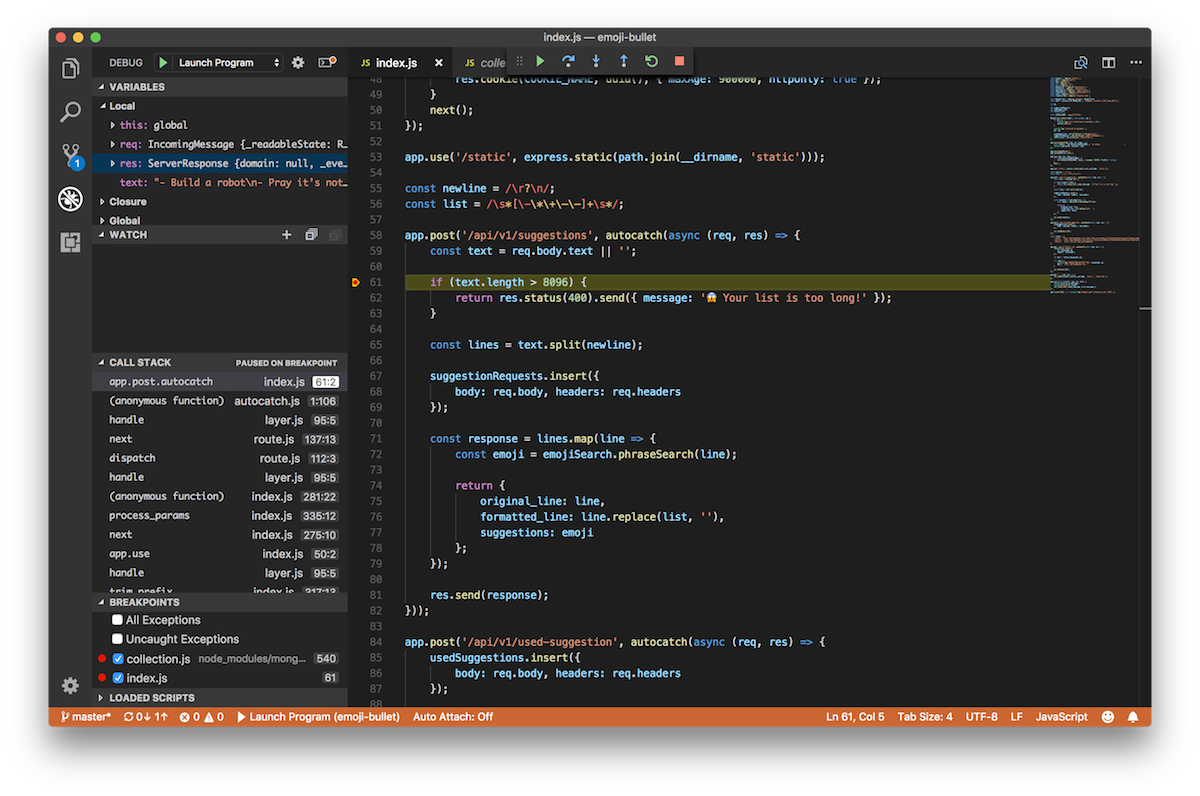
Debugging
Set a breakpoint by clicking in the left hand gutter. A red dot will appear at the breakpoint. If the Debug panel is active (Command-Shift-D), when you hit your breakpoint you’ll see local variables, variables captured in the closure (so cool!) and global variables. You’ll also get a call stack. I’ve been loving this for exploring the Express web framework—something I’ve used in hundreds of projects but never fully dug through the source on.
Step Into, Step Over
Step Over lets you execute the method at the cursor and go to the next line. Step Into moves the debugger into that method where you can keep digging. Repeatedly Stepping Into interesting functions takes you down some super interesting rabbit holes! Give it a try.
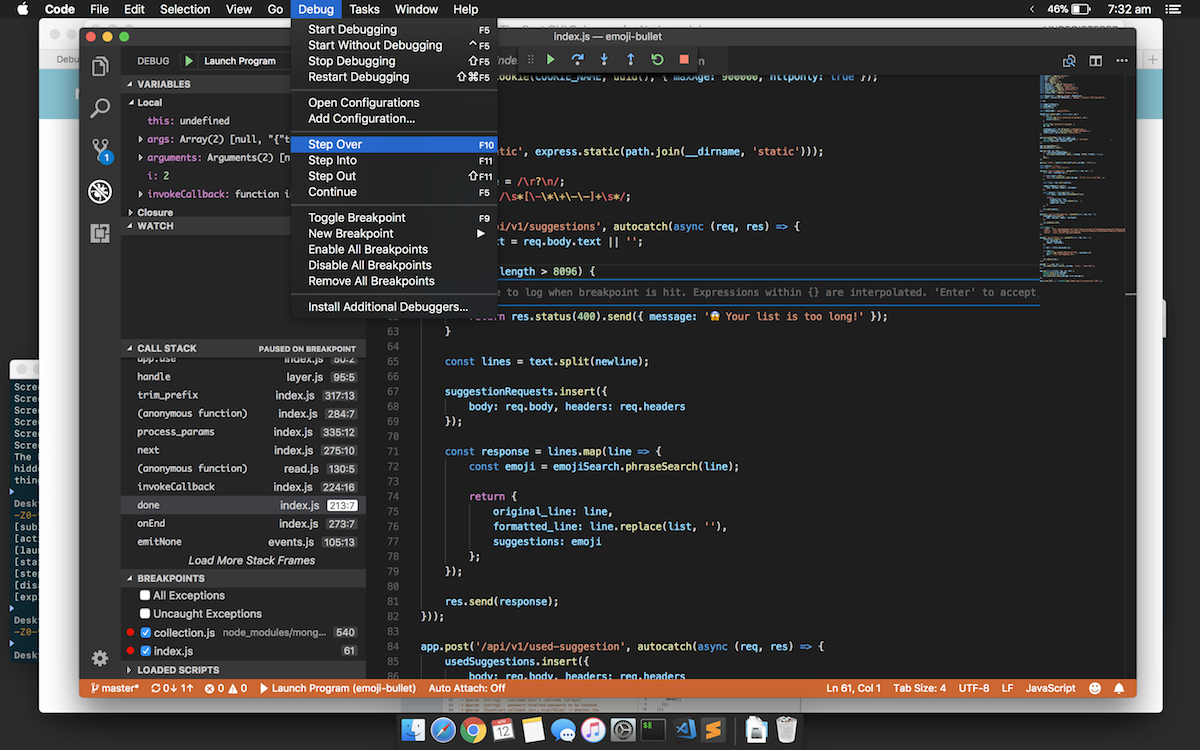
The Touch Bar on your Macbook Pro might actually be useful for once! When you’re in a debugging session, VS Code displays (from left to right) Continue, Step Over, Step Into, and Step Out.
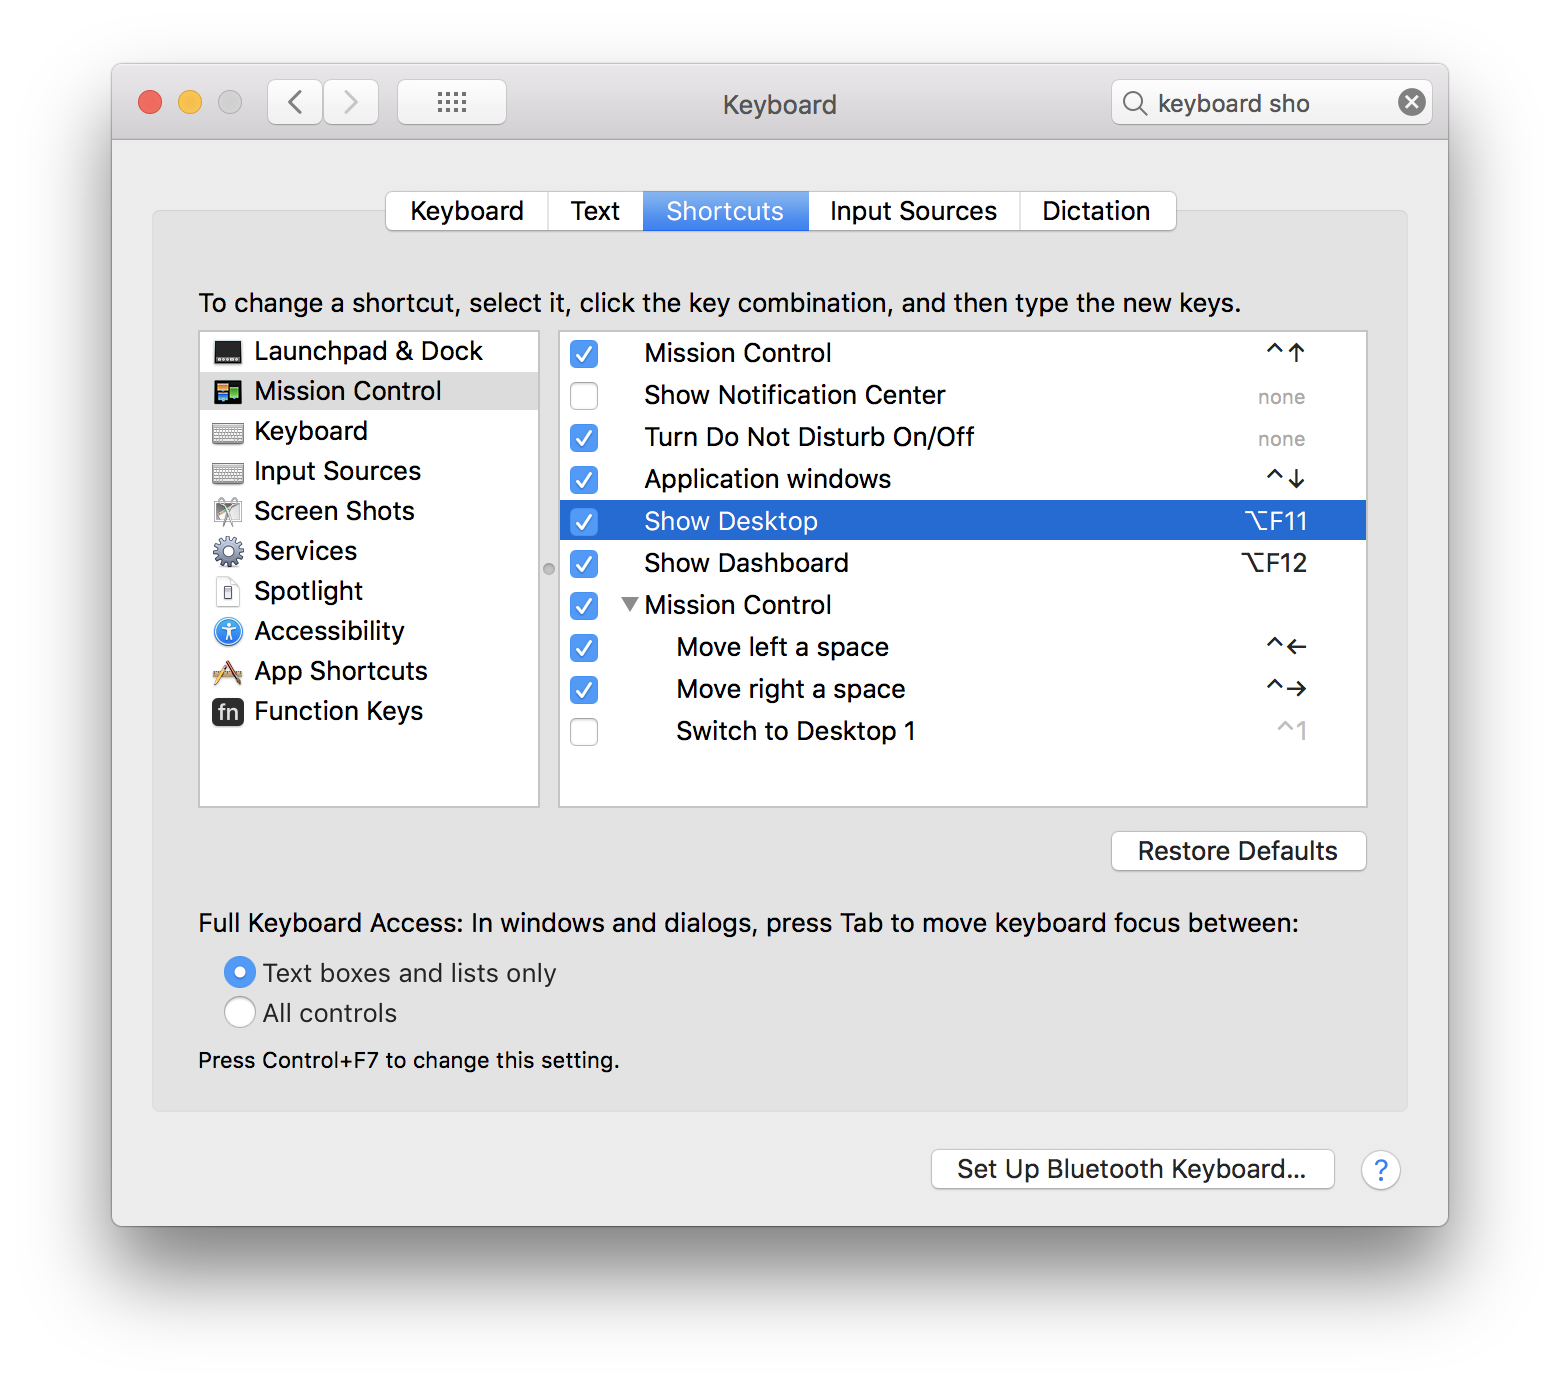
If you don’t have a Touch Bar Macbook Pro, you can use F10 to Step Over, F11 to Step Into, and Shift-F11 to Step Out. One important note: you might have a conflict between the system keyboard shortcut ”Show Desktop” and F11. To disable the system shortcut, open System Preferences, search for Keyboard Shortcuts, select Mission Control in the left sidebar, and choose Show Desktop. Then change it to something that doesn’t conflict with VS Code.
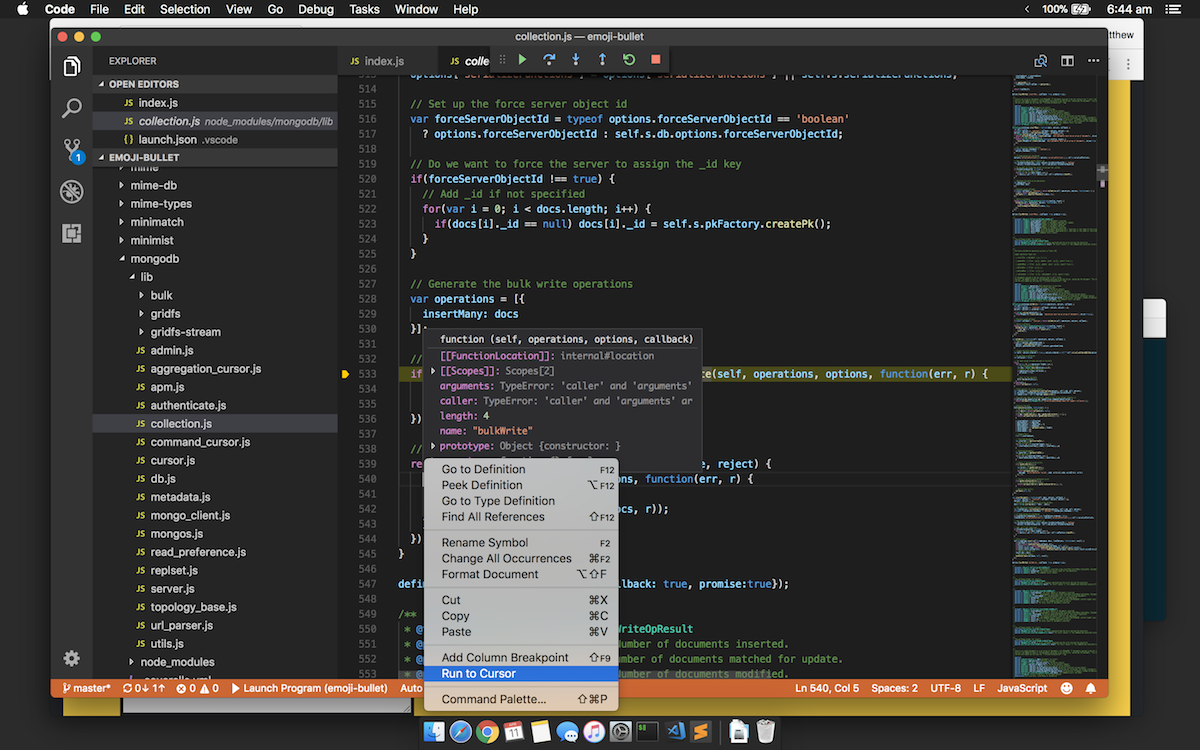
Run to cursor
One of my favourite features of any debugger is ”Run to Cursor” which essentially sets a temporary breakpoint wherever your mouse cursor is, and runs the application until it reaches that point. To do this in VS Code, just right-click on any line after the line you’re currently stopped on, and choose Run to Cursor.
Exploring npm modules
Now that I’ve got a decent debugger, poking through my projects’ dependencies is so much easier. You can simply Step Into any function call or set a breakpoint on a line in their package and then start digging through the code. Once you realise that it’s all just code (and none of it that complicated!) none of them seem so intimidating. Sometimes it’s even faster than looking up the documentation.
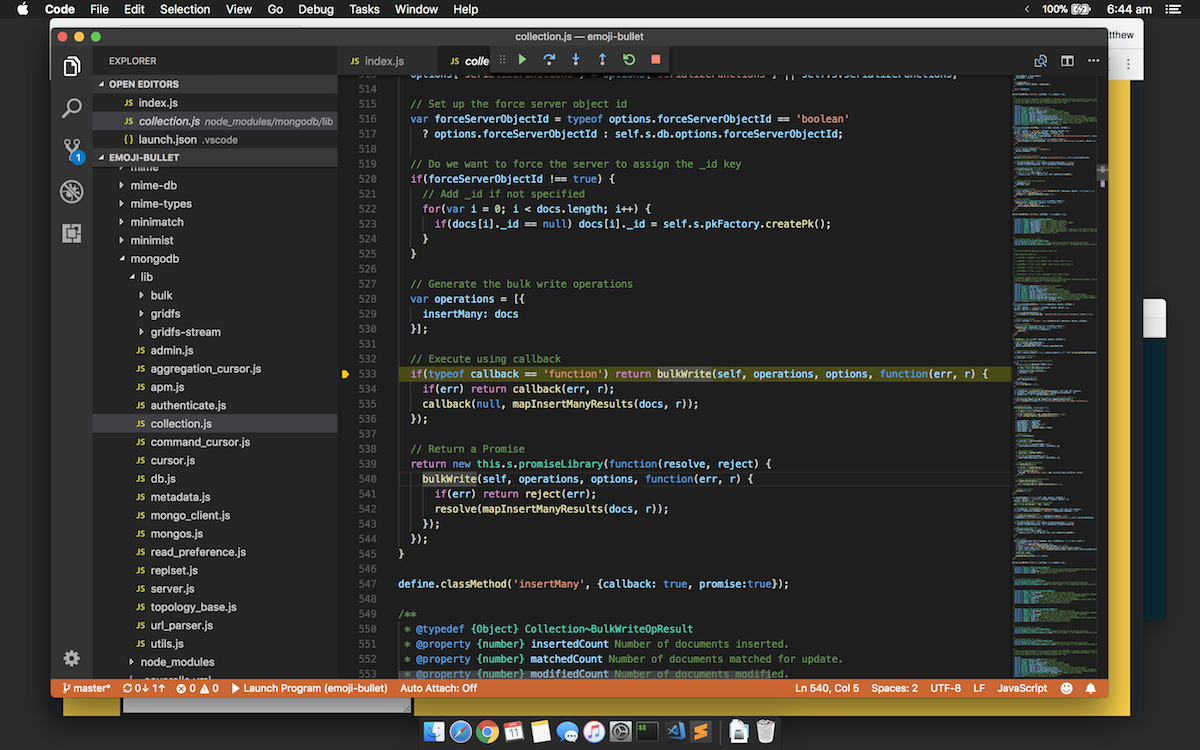
(I love figuring out how things actually work. Like here, where I took a peek how MongoDB’s insertion method actually works.)
Remember to right-click your breakpoints
A couple of other cool features to power up your breakpoints. Right-click one and choose Edit Breakpoint. You can set them to be
- conditional – so they’ll only stop your application when the expression you enter is true
- hit count – only stop after a certain number of times the app has gone through the breakpoint
- log message – which is a way more pro version of our old friend
console.log
More more more
The official guide to debugging with VS Code is available here.
💅 Vanilla – hide icons from your Mac menu bar for free
🚀 Rocket – super-fast emoji shortcuts everywhere on Mac… :clap: → 👏
⏳ Horo – the best free timer app for Mac
📂 FastFolderFinder – a lightning-fast launchbar app for folders and apps
📖 Kubernetes – my book on Kubernetes for web app developers
😄 Emoji Bullet List – easily emojify your bullet point lists (like this one!)
Jump on my email list to get sent the stuff that’s too raunchy for the blog.
(Seriously though, it’s an occasional update on apps I’ve built and posts I’ve written recently.)